Carbon
“Non-graphitic” carbon is similar to graphite, which is characterized by a three-dimensional arrangement of graphite layers (polyaromatic rings with sp2 hybridization). In comparison, the layers in the non-graphitic carbon are also arranged largely parallel to one another, but do not have a three-dimensional crystallographic order. Porous, non-graphitic carbon has a multitude of uses, for example in the purification of gases or water, in filters, as a carrier material for catalysts and as electrode material, etc. We develop processes to produce such carbons with well-defined mesoporosity (5-30 nm pore diameter) and to characterize them with the help of suitable X-ray scattering methods (small and wide angle scattering).
Oliver Osswald, B. Sc./StEx Lehramt
PhD student
Research Interests:
- Carbons with a highly ordered sp2 structure for electrochemical applications
- Microstructure analysis of graphitizable and non-graphitizable non-graphitic carbons
- Modeling and analysis of the intensity distribution of wide-angle X-ray and neutron scattering (WAXS/WANS) for non-graphitic carbons
Synthesis
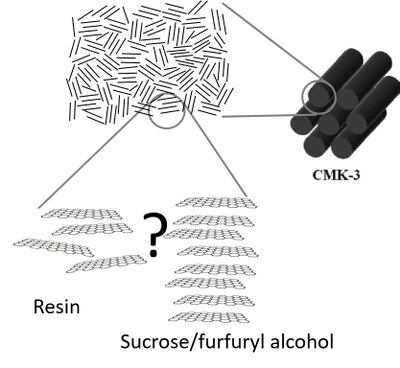
In the synthesis of carbons, a distinction must be made between porous and non-porous materials. In the case of non-porous carbons, the starting molecules (precursors) and the graphitization temperature have the greatest influence on the resulting product. Phenol-formaldehyde resins (PF-R and PF-N) form what are known as “glassy carbons”, ie glass-like carbon. These substances usually have a significantly lower density (ρ ~ 2,2 g/cm3) than graphite (ρ ~ 1,6 g/cm3), which suggests a certain porosity (Badaczewski et al. 2019). Pitch, especially soft pitch with a low softening point, which mainly consists of aromatic molecules, but also natural substances such as sucrose, in contrast to resins, can be graphitized very well, the end product already shows a long-range crystallographic order in all spatial directions (Figure 1). The second decisive effect is the temperature of the graphitization. While conventional and common used laboratory ovens can usually only heat to a temperature of ~ 1200 °C, temperatures of up to 3000 °C are necessary for high degrees of graphitization - only at these temperatures can artificial graphite be produced thermally (Loeh et al. 2016 ).
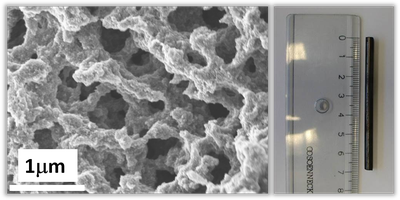
For porous carbons, a distinction can be made between the so-called hard and soft templating processes. The soft templating process uses colloidal silica, for example, which defines the later pores of the product. The carbon precursor is mixed with the silica and heated. The silica is then removed using hydrofluoric acid or potassium hydroxide to create a porous substance (Figure 2). In contrast, the hard templating process uses a rigid grid as a template, for example SBA-15, also a silica compound. In this case, the resulting pore structure is fixed, it corresponds to the negative of silica (Loeh et al. 2018). The main difference is that with hard templating the resulting pore system can be predefined more precisely and thus certain desired pore systems of different sizes and degrees of crosslinking can be produced (Figure 3). One of the best-known substances is CMK-3, which is made of carbon cylinders arranged in parallel and arranged in a hexagonal structure (Figure 1).
Figure 1: Comparison of different precursors as well as representation of the macro and micro structure.
Figure 2: Synthesis of porous carbons using the soft templating process.
Figure 3: Product of a carbon which was produced by the hard templating process.
Analysis
When analyzing the described carbons, two orders of magnitude are particularly interesting: The microstructure, that is, the structure at the atomic/molecular level and the description of the pore system - if available. With regard to the microstructure, the layer dimensions of the individual graphene layers and the stack height are of particular interest. In addition, the C-C bond length as well as the average and minimum layer spacing can be calculated. Furthermore, parameters for the disorder of the sizes already mentioned can be determined so that a complete overview of the sizes and the order of the macrostructure can be determined.
The most important methods for determining these quantities are transmission electron microscopy (TEM), Raman spectroscopy and wide-angle diffraction using X-rays and neutrons (wide-angle X-ray/neutron scattering; WAXS/WANS). Since with TEM measurements only local areas of the sample are considered and Raman measurements are in principle possible, but all parameters can be determined (Schüpfer et al. 2020 & 2021), WAXS/WANS measurements are mainly carried out, which are then carried out using the model of Ruland & Smarsly (2002) (Figure 4), which has already been used in numerous studies (Faber et al. 2014a & 2014b, Pfaff, Badaczewski et al. 2019). The idea behind this model is that a single intensity curve can be calculated for the intra- and interlayer scattering (layers and stacks). The total intensity results from the superposition of these two intensities as well as the background scatter (Figure 5). Suitable software can already be used for Windows (CarbX; Pfaff et al. 2018), a newer, faster method of evaluation for Linux and MacOS using the free Octave software is already submitted. The prelimilary code as well as a short instruction can be found under https://github.com/osswaldo/NGCs. Parameters that can be obtained from this include the layer size La, the mean C-C bond length lcc and its standard deviation σ1, the stack height Lc, the mean and minimum spacing of the layers (a3 and a3, min) and their standard deviation σ3 (Figure 6) .
The physisorption method is usually used to analyze the pore system. From this, the surface, the pore size distribution and, by means of suitable hysteresis measurements, the pore crosslinking and accessibility can be determined. Difficulties here are that instead of nitrogen, which is usually used for physisorption measurements, argon has to be used for carbon samples. At the same time, the pore system is either often disordered (soft templating) or has a geometrically non-trivial pore structure (in the case of CMK-3, the inverse of cylinders), so that a suitable model must be found and applied for precise analysis. This method is supplemented by small angle X-ray/neutron scattering; SAXS/SANS, which can also provide information about closed pores that are not visible during physisorption (Smarsly et al. 2002, Badaczewski et al. 2020 ). In addition, these measurements can help to improve the previous theories of physisorption and to find suitable models for the pore systems.
Figure 4: Overview of the analysis of the carbon microstructure using X-ray / neutron scattering.
Figure 5: The resulting total intensity in WAXS / WANS measurements is made up of the intralayer, the interlayer and the background scatter.
Figure 6: Physically meaningful microstructure parameters that can be determined from the analysis of the scatter data.
Open questions
Of course, this presentation of the carbons and the analysis are not yet conclusive, rather there are still open questions:
- How does the temperature influences the microstructure?
- What happens at the atomic/molecular level during graphitization?
- What influence do the precursors have, in particular the content of foreign atoms such as nitrogen and oxygen?
- How can graphitization be improved or prevented?
- How can the previously required temperature of 3000 °C be reduced?
- What are the limits of the previous model by Ruland & Smarsly (2002)?
- Can the model also be applied to neutron scattering?
- What happens with very high modules of the scettering vector, can the model still capture these values?
- Can it also evaluate pair distribution function (PDF) data? Do these results agree with the scattering data?
- Can the model also be applied to graphs? Do the pore systems have an influence on the microstructure?
- Do the pore systems have an influence on the microstructure?
- How can more specific modifications such as graphene or large-pore systems for electrochemical applications be efficiently produced?
- Can electrochemical effects (conductivity, intercalation properties, etc.) as well as macroscopic parameters (tensile strength, hardness, etc.) be determined or even predicted using the microstructure?
Further reading
Badaczewski, F. et al., Beilstein J. Nanotechnol. 2020, 11, 310–322
Badaczewski, F., et al., Carbon 2019, 141, 169-181
Faber, K. et. al., J. Phys. Chem. C, 2014, 118, 29, 15705-15715
Faber, K. et. al., Z. anorg. Chem., 2014, 640, 15, 1307-1317
Loeh, M. O. et. al., Carbon, 2016, 109, 823-825
Loeh, M. O. et. al., Carbon, 2018, 129, 552-563
Osswald, O. & Smarsly, B. M. (2022). C. 8(4), 78
Pfaff, T. et al., J. Appl. Cryst., 2018, 51, 219-229
Pfaff, T., Badaczewski, F. et. al., J. Phys. Chem. C, 2019, 123, 33, 20532-20546
Ruland, W. & Smarsly, J. Appl. Cryst., 2002, 35, 624-633
Schüpfer, D., et al., Carbon, 2020, 161, 359-372


