Genome Browser
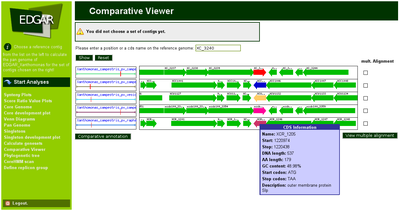
The Genome Browser allows the analysis of orthologous genes in their genomic context.
To observe the synteny of genes at a smaller scale than in the synteny plot the comparative view was
developed. In this visualization the orthologs of one selected gene are shown in their genomic neighborhood. This means, if for one reference gene the set of orthologs is computed, the positions of these genes in their respective genomes are aligned, and the genes are shown togther with all other genes in a 10 kb window around them.

This visualization allows to easily analyse conserved structures like operons or the general synteny of genomes. Furthermore, if there is a certain level of synteny, missing genes can be easily spotted and it can be checked if they are missing due to defective gene prediction or if a gene was truly deleted.
