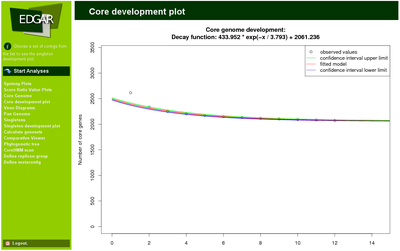
Core/Singleton development plots
These statistical analyses allow to approximate the "real" core genome size or singleton number for higher numbers of genomes.
A core genome calculated on a certain set of genomes is always only a snapshot of the situation for exactly this genome set. To gain insight into the “real” core genome of a species one can try to extrapolate the number of core genes for a set of genomes of infinite size.
This is done by an approximative approach by Tettelin et al. (2005): One estimates the number of core
genes for every possible permutation of k available genomes and stores the number of observed core genes for each particular genome count n – either a mean or a median value, or as distinct single values. For distinct single values Tettelin et al. also count core genome sizes for identical genome combinations in different order to reflect bias introduced by paralogous genes.
As identical paralogs are filtered in EDGAR and furthermore the bias introduced by differing genome order is negligible, EDGAR uses only unique permutations and thus only the simple binomial coefficient with n choose k different combinations for n out of k genomes.

The number of core genes is plotted as a function of the number of compared genomes and serves as input for a non-linear least squares curve fitting approach. An exponential decay function is fitted to the data. This allows to extrapolate the size of the core genome for n → ∞. This value indicates how well the core genome of the currently available genomes reflects the “real” core genome of, e.g., a genus. In a similar approach the expected number of singletons for each newly sequenced strain can be predicted.
