
Images
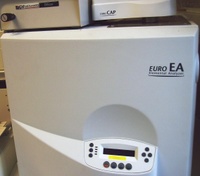
Abbildung 3.1.1.1a
Elemental Analyzer (station I) for carbon and nitrogen; Instruments in configuration for stable isotope ratio mass spectrometry (sIRMS)
Anzeigen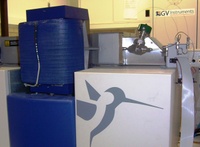
Abbildung 3.1.1.1b
Anzeigen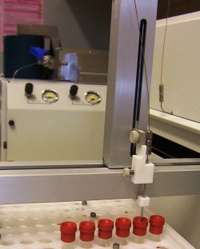
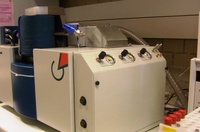
Abbildung 3.1.2.1b
Anzeigen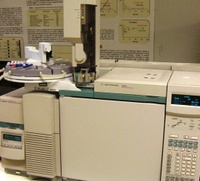

Abbildung 3.1
Anzeigen
Abbildung 3.2.5d
Anzeigen

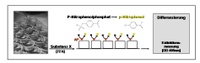
Abbildung 4.3.1.1
Metabolization of pNPP to p-nitrophenol (yellow) by the membrane–bound alkaline phosphatase of live cells.
Anzeigen
Abbildung 3.2.5b
Anzeigen

Abbildung 3.2.5a
Anzeigen
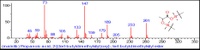
Abbildung 3.2.5c
Anzeigen
Abbildung 4.2.2
Anzeigen
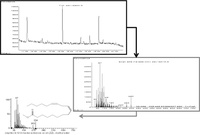
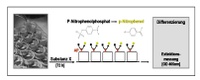
Abbildung 4.2.3
Metabolisierung des pNPP zum gelben p-Nitrophenol durch membranständige alkalische Phosphatasen lebender Zellen.
Anzeigen
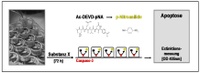
Abbildung 4.4.1.1
Hydrolysis of the colorless substrate Ac–DEVD–pNA to the colorimetric assessable p–Nitroanilid (yellow) by activated caspase–3 as measure of an early apoptotic event.
Anzeigen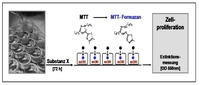
Abbildung 4.2.1.1
Prinzip des MTT-Assays. Metabolisierung des MTT-Farbstoffes (gelb) zum MTT-Formazan (blau) durch mitochondriale Dehydrogenasen (mDH) lebender Zellen.
Anzeigen
Abbildung 3.3.2
Anzeigen
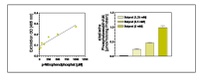
Abbildung 4.3.2
Anzeigen
Abbildung 4.5.2
Anzeigen
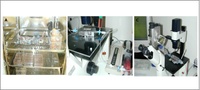
Abbildung 4.6.1.1
(A) Preparation of HUVEC obtained from umbilical cord veins; (B) flow chamber and perfusion system as well as (C) video documentation of adherent cells using the flow model.
Anzeigen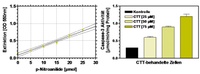
Abbildung 4.4.2
Anzeigen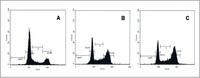
Abbildung 4.5.1
Histogram of a flow cytometric analysis of the cell cycle in control cells (A) and treated cells (B and C)
Anzeigen
Abbildung 4.7.1
Anzeigen
Abbildung 4.6.2
Anzeigen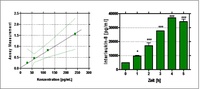
Abbildung 4.7.2
Calibration curve for interleukin-8 (IL-8) (left) as well as the evaluation of the time dependent activation of IL-8 secretion by tumor necrosis factor in epithelial cells.
Anzeigen
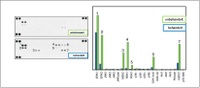
Abbildung 4.8.3
Human Phospho–MAPK array kit for detection of multiple phosphorylated kinases in treated as well as untreated cells.
Anzeigen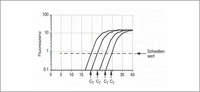
Abbildung 4.9.1
Principle of quantitative real-time PCR. Increased fluorescence in dependency of differnet cDNA concentraions. Threshold (CT) is the level of fluorescence above the baseline, at which the signal can be considered not to be background. It is defined as the
Anzeigen
Abbildung 4.9.2
Anzeigen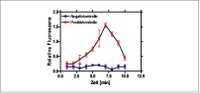
Abbildung 4.10.2
Generation of superoxide anions in dependency of time. Intestinal cells were loaded with MitoSOX Red reagent and finally incubated for 30 min with the test compunds. The increase of the fluorescence as a result of oxidation of MitoSOX Red can be detected
Anzeigen

Lunge
Anzeigen


kolonkarzinom
Anzeigen

endothel
Anzeigen

