June 2010The right part of the picture is an optical image of a sample surface. On the left are three stacked SIMS image scans of the same sample area (500 µm X 500 µm). Dark colors (red to black) show areas of less signal intensities and bright colors (yellow to white) show areas of higher signal intensities. The surface structures can be seen in the total ion image (on the bottom of the left column, TI). The same can be seen in the distribution of Strontium (Sr) and Magnesium (Mg). Picture submitted by S. Steinmüller https://www.uni-giessen.de/en/faculties/f08/departments/physchem/janek/gallerypotm/gallery-of-pictures-from-2010/june-2010/viewhttps://www.uni-giessen.de/@@site-logo/logo.png
Document Actions
June 2010
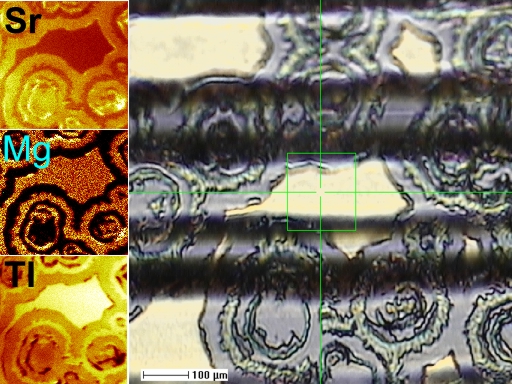
The right part of the picture is an optical image of a sample surface. On the left are three stacked SIMS image scans of the same sample area (500 µm X 500 µm). Dark colors (red to black) show areas of less signal intensities and bright colors (yellow to white) show areas of higher signal intensities. The surface structures can be seen in the total ion image (on the bottom of the left column, TI). The same can be seen in the distribution of Strontium (Sr) and Magnesium (Mg). Picture submitted by S. Steinmüller
